Create Pie-Chart as Dashlet
Hi Team,
to build good Overview Dashboards for non technicals Pie-Charts are a great visualization also for using in Reports.
Greets Bernd
Comments: 4
Oldest
•
Newest
•
Most likes
•
Fewest likes
-
27 Mar, '24
Bernd HolzhauerHighlighted comment
as example to visual Memory, CPU, Filesystems, Notifications, Events, Alerthandler .....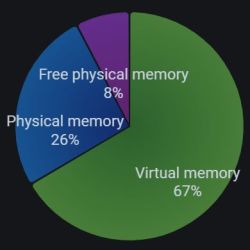
-
02 Mar, '23
Benson Thomas MergedIt will be helpful if we have a graphical representation of host and service summary in reports like pie chart.
-
25 Mar, '24
Mohamed Saleh AdminHi Bern,
Thank you for posting on the Ideas Portal.
We are interested to learn more about your use case. Could you provide more context as to why you want to have a Pie chart and what kind of information you would want to visualize. Your input would be highly appreciated.
Thanks very much and warm regards,
Your Checkmk Team -
03 Nov, '25
Martin Hirschvogel System"Graphical representation of host and service summary" (suggested by <Hidden> on 2023-03-02), including upvotes (20) and comments (0), was merged into this suggestion.
