Dashboards: add custom widgets under ~/local/lib/python3/cmk_addons/
Since you rewrite the dashlets/widget concept again in Checkmk 2.5, please intergrate a possibility to add custom widgets under the ~/local structure.
Comments: 6
Oldest
•
Newest
•
Most likes
•
Fewest likes
-
21 Jan
Mohamed Saleh AdminHi Stefan,
Thanks for posting your idea!
To have a bit more context about your use case, can you give us an example of the customer widgets you want to add?
Best,
Saleh -
22 Jan
StefanMHello Saleh,
at the moment we use 4 dashlets and are planning to add a 5th. The use case is the (high level) visualization of monitoring data which follows dependencies like chosen sites, customers or combination of services and providing useful information for endusers or communication/reporting.
Common functionality: Dashlets respect the filters on the dashboard (e.g. only show the donuts/charts/services for the selected sites). Visualizations are or can be combined (e.g. donut chart [services] + gauge [computed health %]). Dashlets can be added over drop-down menu (see dashlets-menu.png)
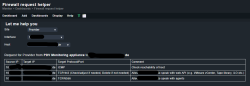
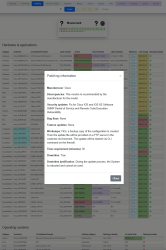
- Showing the firewall rule(s) to request for a given site with valid monitoring instances for the checked-in hosts. Rules are based on pre-defined rulesets for the chosen tag [e.g. "Windows"] (see fw-request-helper-1.png)
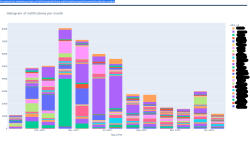
- Showing (monitoring) infrastructure analysis (e.g. number of notications per site/month/host/service) (see notification-analysis.png)
...
-
22 Jan
StefanM...
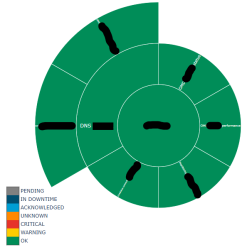
- Visualize BI-tree as sunburst diagram (see bi-tree.png). The original tree contains all sites (or a subset of all sites). This is the dynamic drilldown only because i didn't want to erase 200 hostnames/services.
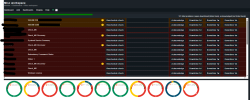
- Management dashlet for easy access to acknowledge/set downtimes for filtered sites/hosts/services. Works on global(!) scale despite we don't have central configuration of satelites (see management-dashlet.png).
- Donut dashlet (combined with gauge/customer logo) (see management-dashlet.png [bottom]). I've already shown this at conference #10 and #11.
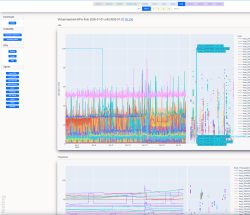
- High level (inline/almost live) reports with additional data from other sources like CMDB/SIEM/ERP (see almost-live-report-*.png; generation of report takes around 20-120 seconds per site)
...
-
22 Jan
StefanM...
The concepts are the same for all of our dashlets:
1. Collect (filtered) data from livestatus(-proxy) and optional other sources
2. Analyze and visualize data
3. Output dashlet
With Checkmk 2.5 the following problems will occur:
1. Dashlets are not loaded, because there is no longer a valid location ("~/local/lib/python3/cmk/gui/plugins/dashboard/" works currently), 2.5 erases all(!) files in this location on update, dashlets under ~/local/python3/cmk_addons/plugins/mydashlets/*/* are not loaded
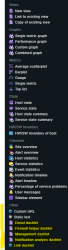
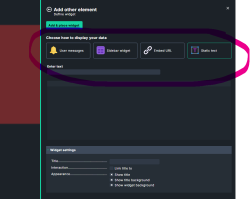
2. The usable widgets (and their configuration) is precompiled (Vue) and cannot be changed at runtime (current "suspect": ~/share/check_mk/web/htdocs/cmk-frontend-vue/assets/main.js) (see flyout.png)
...
-
22 Jan
StefanM...
How to solve?
1. Checkmk should massively improve visualization (=add diagram-dashlets) to achieve at least the currently possible quality (our diagrams are interactive/filterable/zoomable/combinable [scatter-plot+box-plot/histogram/violin-plot or piechart+image+gauge]), integrate customizable API-calls / loading and merging additional data from other sources
2. Make the Vue-stuff (widget flyout-content) customizable and provide a valid path for placing dashlets under "~/local/python3/cmk_addons/plugins/*/dashlets"
Thanks -
27 Jan
Mohamed Saleh AdminHi Stefan,
Thanks a lot for providing these details and the screenshots, extremely helpful for us to understand your use case.
Best,
Saleh


