Fully support lower levels by the CheckMK graphing system
The CheckMK graphing system supports the use of scalars in graphs for warning/critical levels, and the use of conditions for perfometers using the "<var>:warn" and "<var>:crit" notation. Unfortunately, this currently only works for upper levels, not for lower levels.
For services like battery capacity, signal/noise ratio and sometimes also temperature, exceeding lower levels is of much more concern than the upper levels. Support of lower levels by the graphing system opens the possibility to visually enhance the data view for these kind of services. For instance by showing the lower scalars and/or by creating perfometers that are coloured green/yellow/red according to the service state. This is now only possible for services that use upper levels.
Comments: 4
Oldest
•
Newest
•
Most likes
•
Fewest likes
-
22 Apr, '25
lars MergedCheckMK should be able to display upper and lower threshold values in graphs.
Currently, only upper threshold values are displayed. The lower threshold values are only used to change the status. -
22 Apr, '25
Martin Hirschvogel System"local check with upper and lower threshold values in the graph" (suggested by <Hidden> on 2025-04-22), including upvotes (1) and comments (0), was merged into this suggestion.
-
07 May, '25
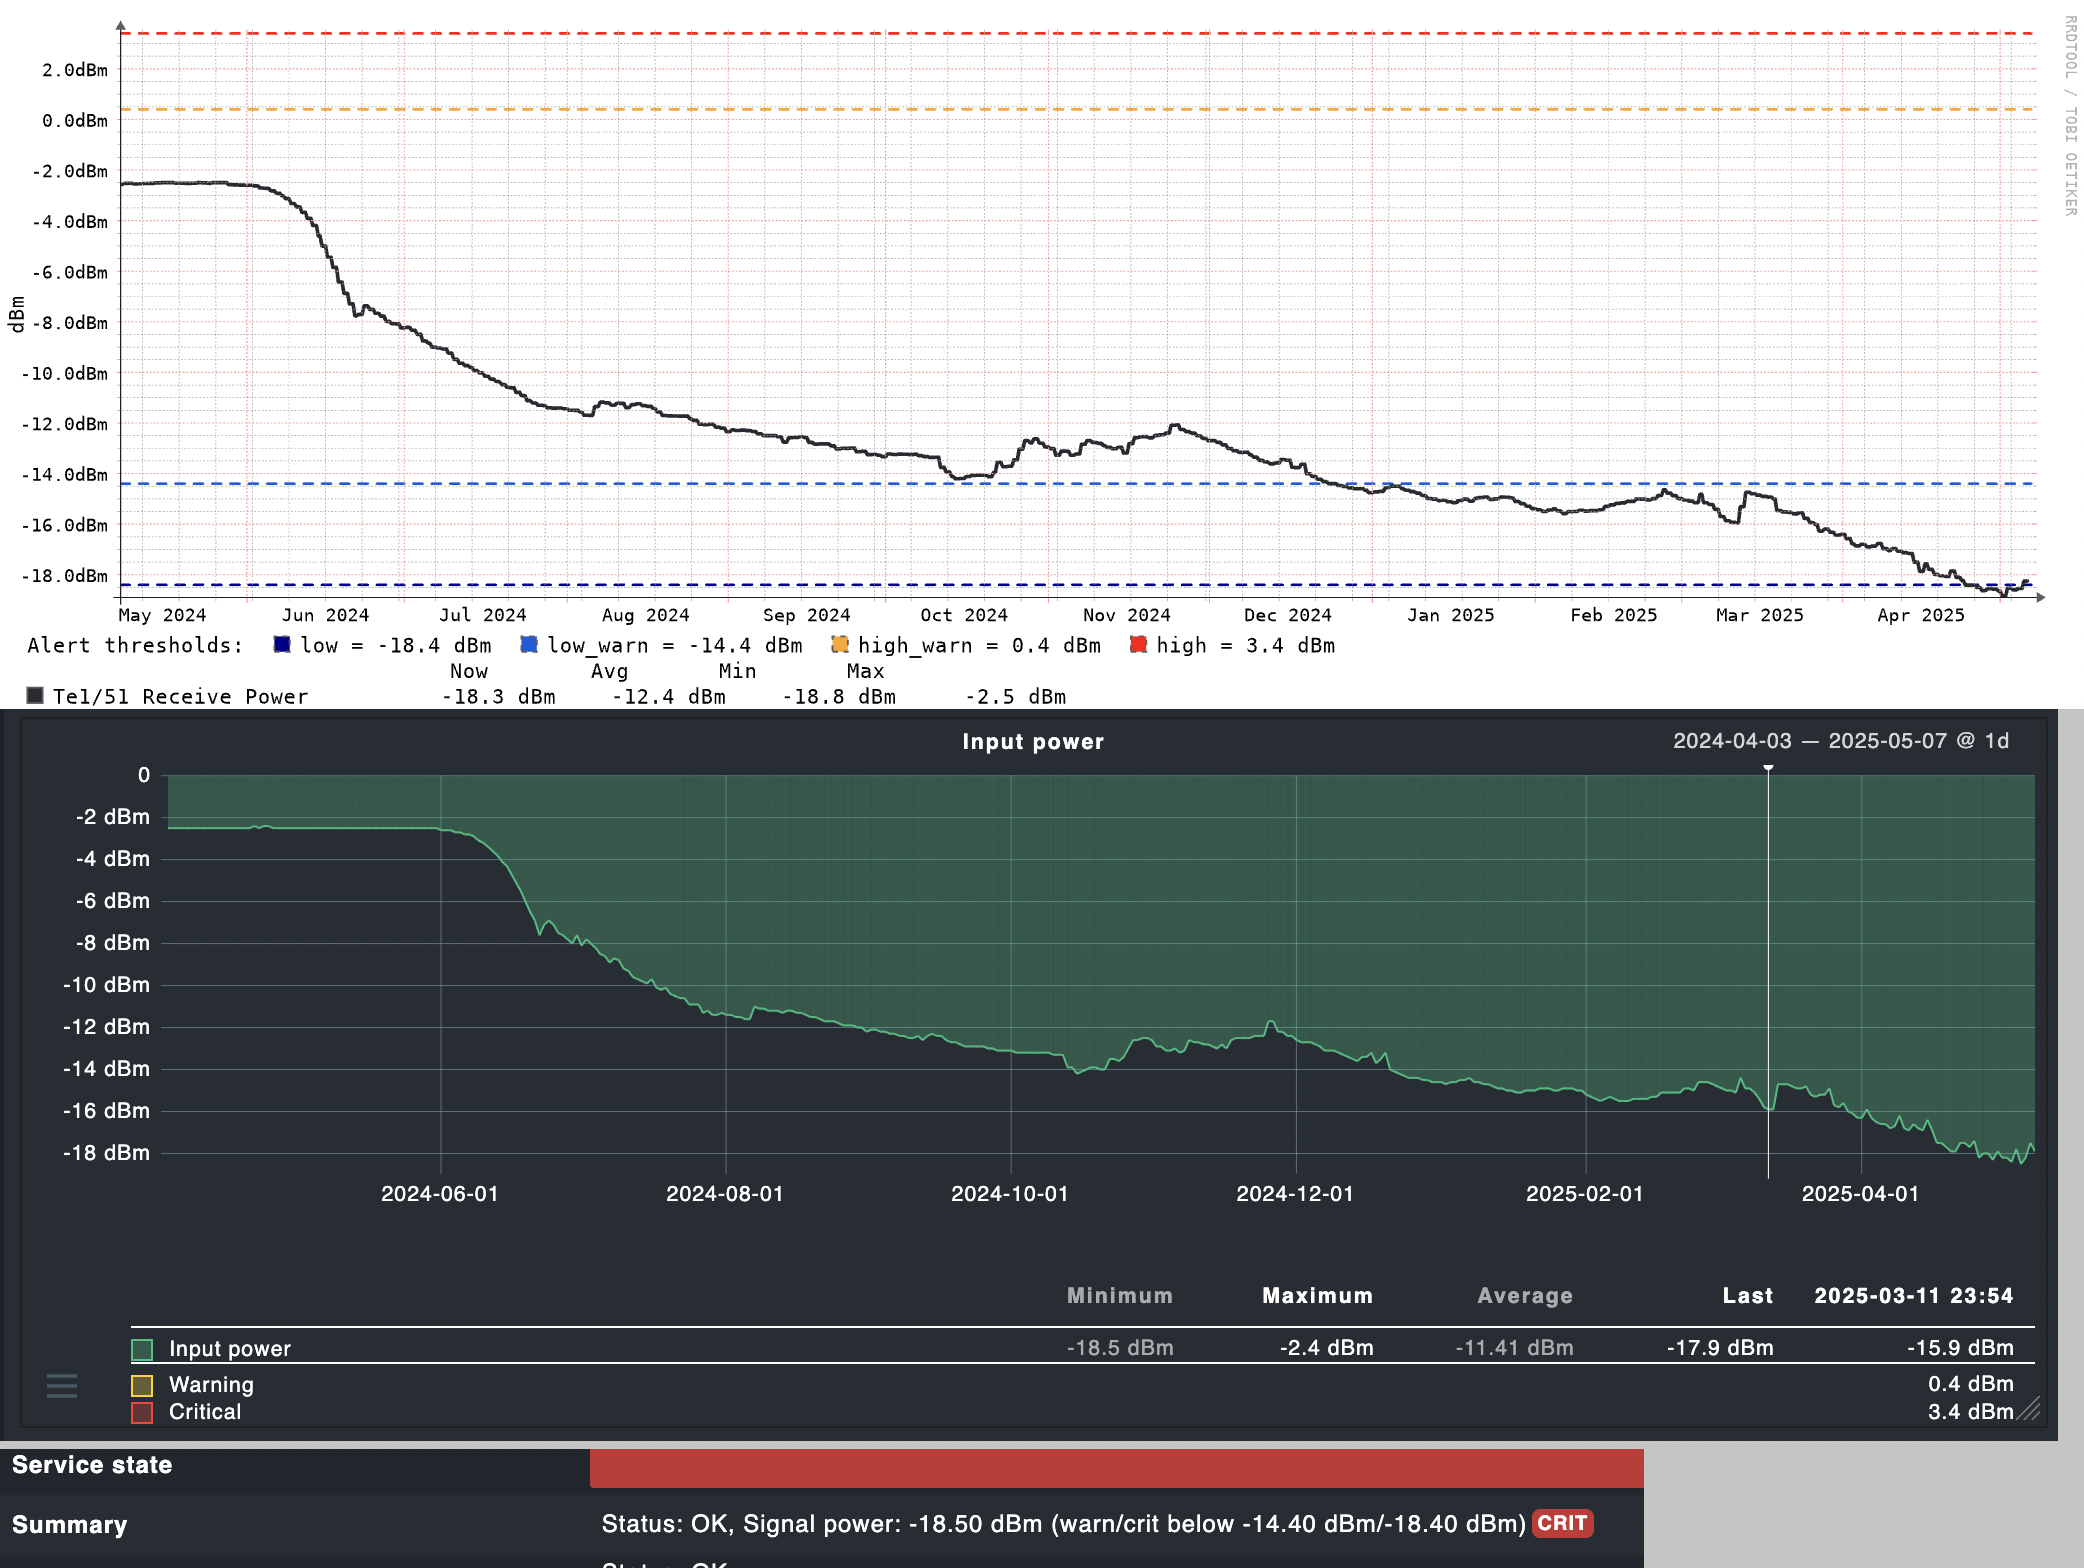
Jay2k1Yes please! In addition to the aforementioned battery capacity, SNR and temperature, I'd like to add humidity, voltage and signal levels. The latter is very common in networking using fiber optics: transceiver modules like SFP modules report their RX and TX levels, and for these, lower levels are crucially important. See attached screenshot, comparing the RX levels graphs of an SFP module in libreNMS vs Checkmk.
To make matters worse, the CMK graph shows neither upper nor lower threshold, because the measurements are negative dBm, but the upper thresholds are positive numbers. And the legend only shows the upper warn/crit thresholds.