Bubble & Rectangle Dashboard Widgets
It will be helpful to have bubble or rectangle Dashlets to show the highest state of host groups, service groups or events by criteria. With this kind of dashlets you can build pretty overviews.
Comments: 3
Oldest
•
Newest
•
Most likes
•
Fewest likes
-
20 Dec, '23
Niklas Pulina AdminHi Michaelski C., thank you for your suggestion. It would be great if you could share a sketch or take a screenshot from any other application that offers such a dashlet and share it here so that we - and other Ideas Portal users - can get a better understanding of your idea.
Many thanks in advance! -
03 Jan, '24
Michaelski C.Hi Niklas.
I think it will be helpful to have some dashlets to show a highest state of a hostgroup, servicegroup or similar objects like in the given picture. This can used for godd overview dashboards. I hope it will help for a better understanding.
Regards, Christian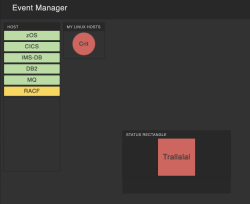
-
05 Jan, '24
Niklas Pulina AdminHi Michaelski C., thanks so much for your reply.
To increase the chance that people vote on your idea, you might want to change its title in a way that it reflects the "what" more than the "how". What would you think about changing it to "Dashlet to show best/worst state of host/service group" or similar? Thanks.
By the way: Depending on your specific use case, our BI functionality and its visualization capabilities might be interesting for you: https://docs.checkmk.com/latest/en/bi.html#visualization
