Top 10 hosts dashlet
Allow to define a dashlet, which filters about some host information and shows only the top 10 hits from the results. This allows me as an admin to focus on specific servers (Example: top 10 by CPU, disk usage, memory consumption)
Comments: 17
Oldest
•
Newest
•
Most likes
•
Fewest likes
-
11 May, '22
Daniel RoettgermannEnhance it with AI! (we are in 2022)
Having the Top 10 by CPU or Memory is fine (better then nothing), but not always shows you the real critical ones.
For some Host its normal that they have high load at a certain time of the day/week (due to some regular job handling), one the simple approach this will leed to many false alarms in the dashboards/dashlets
This can be easily avoided by AI which is aware about it and only shows you the anomalies which are actually related to a problem -
13 Jul, '22
Christian Friedrich MergedSometimes we have problems with the load of a slave site. We always find it difficult finding the problem in this situation. It would be helpful to have more views within checkmk that show you e.g. which hosts or which services use especially many checkers/fetcher. Or generally the top 10 hosts that are responsible for the most load on the backends. This would definitely be helpful in narrowing down the causes of performance problems.
-
13 Jul, '22
Marcel Arentz System"Troubleshooting; Top Hosts / Services (Backend Performance)" (suggested by Christian Friedrich on 2022-07-13), including upvotes (2) and comments (0), was merged into this suggestion.
-
28 Sep, '22
Thomas Lippert AdminThe challenge with this feature is, that in distributed monitoring, the master needs to get all top 10s from the different sites to create a consolidated Top 10 list. Currently, the core does not allow for this, making the implementation very expensive.
Question: If this feature only works for the actual site, would it still provide value? -
07 Feb, '23
Thierry T.Chiming in here: For us, the top 10 (or "top any", really) should show information from all sites.
-
07 Feb, '23
Thomas Lippert AdminThanks Thierry for your opinion on this topic. I can fully understand the demand, but it makes this feature rather expensive :-(
-
15 Feb, '23
DanielWe requested, discussed and planned it in 2019, supposed to be already part of the Capacity Mgmt "light" implementation.
"Last minute" plan of changes, "cant be impemented, not possible to do in the short of time left before the release" - now about X Releases later, still desperately waiting for it and not the only ones as it seems.
@Thomas
So can we please schedule this for 2.3?
It would certainly bring the Capacity Management on a proper level where you can finally work on it in a view/dashboard way with all functionality and export it in reports.
We believe with a proper integration you could not only make your customers happy, but also get a again some bigger lead towards your direct competitors -
20 Feb, '23
Thierry T.@Thomas: I can imagine certain bottlenecks, too. We currently run ~80 sites. Constantly fetching information from every site would yield a heavy impact on performance, I guess. Our operations engineers often ask for this functionality, though.
If this feature were to be considered, maybe some kind of compromise could be implemented? Like "Top 10 hosts/services (last 15 minutes)"? Like this, information of all sites would only have to be fetched once in 15 minutes. IMO the interval could be configurable for the user. If a certain lower limit gets undercut, you may show a warning message regarding probable performance implications?
Another way could be to asynchronously collect information on every site directly (again, in fixed intervals or dynamically per host & service as they get checked). Then the main site would only have to query a pre-computed table. -
21 Mar, '23
Doc"bottlenecks"
this should be mitigated with the usage of a caching functionality. Top 10 problems are not so time depending -
05 May, '23
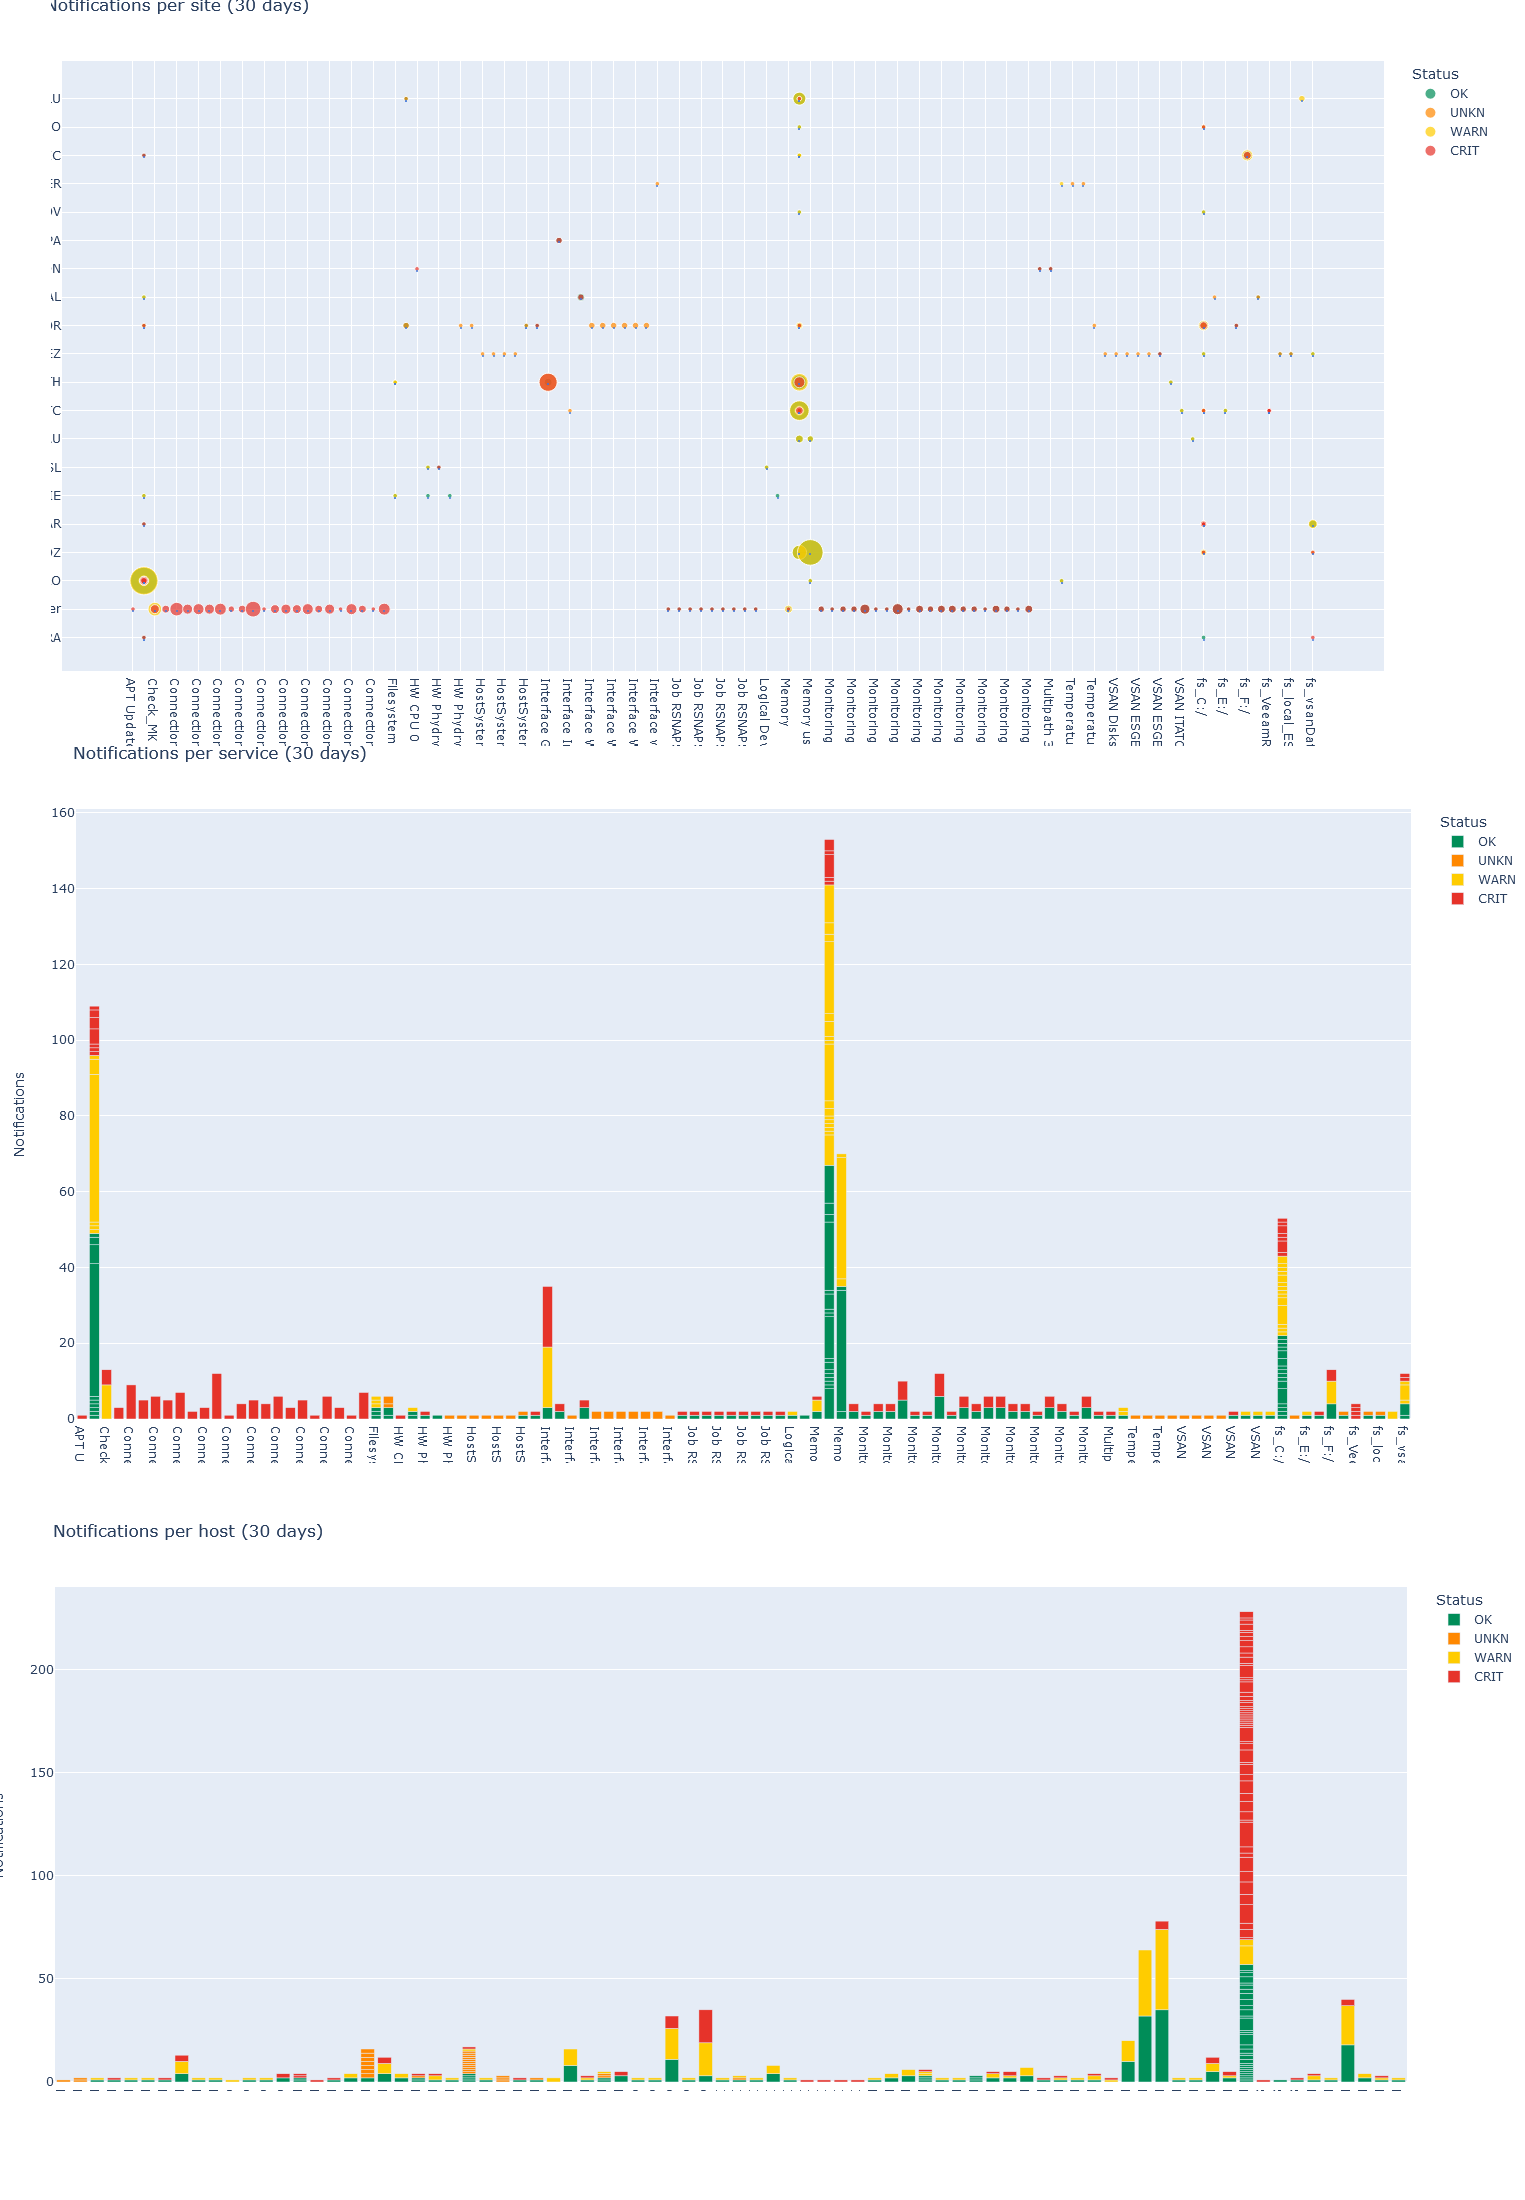
StefanInspired from the top talkers I build my own views once per day to find the hot spots in our monitoring (about 30 customers, 1500 hosts, 55k services).
I'm currently making progress in building my own dashboards/dashlets, It's nice to access all distributed data and work with it, besides I still have problems to create direct callbacks (i.e. press a button and directly acknowledge a problem).
I used dash for interactive dashboards (with real callbacks) and now switch to "inside-checkmk" and plotly/plotly express as graphing library.
This one is interactive (zoom, scroll, (de-)select) for further drilldown.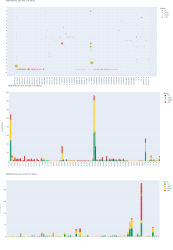
-
09 May, '23
DanielHey Stefan
Notifications is also a topic: But there at least in views you can quite easy filter already your top talkers. So far I think I havent hit any "big" wall.
But in terms of Graphing, Would you mind sharing it in the forum with the community? looks interesting and maybe useable for other topics.
@Thomas
Could you answer the open questions from Thierry T and I? -
10 Jul, '23
Tanja Hohenstatt AdminHey everyone,
Good news! We're moving forward with your feature request. To define the requirements and understand the problem it solves, we need your help.
If you're available for a chat (30–60 minutes), please fill out this form: https://app.useberry.com/t/kl37CG29BLODUF/ [closed as enough participants have been found]
We'll reach out to you soon :)
Cheers, Tanja. -
31 Jul, '23
DanielHi Tanja
Link is not working. In addition, there are at least 2 tickets we opened up since 2019 (supposed to be part of the MSE), describing the fundamentals.
Cheers
Daniel -
31 Jul, '23
Martin Hirschvogel AdminThe link is expired as enough participants have been found by now. Please reach out directly to Tanja - but I believe she has/will reach out to you anyway Daniel.
-
12 Mar, '24
Niklas Pulina AdminHello,
Good news! Your idea has been implemented into our software. The functionality is available in the current beta and will be published with Checkmk 2.3.
For more details, please see https://checkmk.com/werk/16040
Warm regards,
Your Checkmk team -
24 May, '24
Martin Hirschvogel AdminHello,
This feature is released with Checkmk version 2.3.0.
Warm regards,
Your Checkmk team